The nice people at Solar Power Rocks asked me to link up with them. AWWWWW somebody else loves CES! Anyway they are going to explain html LINKS to me so I can try to do it.
http://www.solarpowerrocks.com/
In the mean time this is todays post:
| Get our RSS Feed |
About the Editors:
Dave Llorens
Dan Hahn
Wear us out!
-
Kansas

-
Kentucky


-
Louisiana


-
Maine


-
Maryland


-
Massachusetts


-
Michigan


-
Minnesota


-
Mississippi

-
Missouri

-
Montana


-
Nebraska

-
Nevada


-
New Hampshire


-
New Jersey


-
New Mexico


-
New York


-
N. Carolina


-
North Dakota


-
Ohio


-
Oklahoma


-
Oregon


-
Pennsylvania


-
Rhode Island


-
South Carolina


-
South Dakota

-
Tennessee

-
Texas


-
Utah


-
Vermont


-
Virginia


-
Washington


-
Washington DC


-
West Virginia

-
Wisconsin


-
Wyoming

California Bay Area Solar Market Analysis
Posted on April 16, 2008 by Dan Hahn.
Categories: Solar Trends.

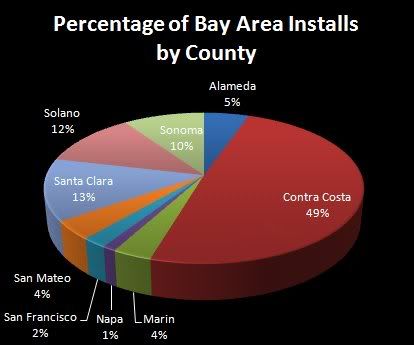
We’ve noticed that there’s been quite a bit of chatter and advertising dollars thrown into solar in the bay area over the past year or so. For instance, we were just at a San Francisco Giants game last week and couldn’t help but notice the numerous PGE ads for their solar installation at AT&T park urging homeowners to consider the switch to solar. Glitzy ads from large oil companies (ahem, right right, “energy companies”) also emblazoned large billboards with solar elements. Well, the incentives in California are so good, that we started to wonder how many homeowners out of total in the bay area are already on board. So, it’s time for some good ol’ fashioned data analysis of the Bay Area residential solar market. The figures below were generated from data sourced by one of Dave’s colleagues. See the sources below for more info on their lineage.

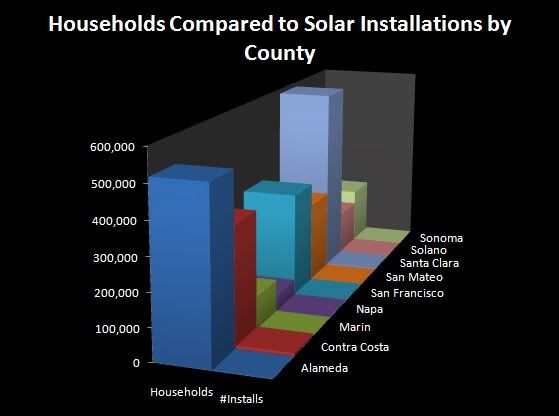
As you can see from the image above, Contra Costa county accounts for just about half of the solar installs in the bay area over the past 3 years. The other counties pale in comparison. However, you can see from the chart below that there is a substantial way to go to penetrate the rest of the bay area market. While Contra Costa county does account for half of those installs, consider that that county is only about 2% saturated!

Key Assumptions
1. Size, Installed Price and # of installs numbers based on solar installs from 11/05 -1/08 –See
http://www.energy.ca.gov/renewables/emergingrenewableslindex.html
2. Population and Households data based on 2006 ACS Census estimates –See
http://www.bayareacensus.ca.gov/ for details
3. Penetration calculated as % of households with solar.


Pingback: Solar Power Rocks - This is a pretty cool site | Solar Powered Cars . Net