Time Out For LEAN – Update on Dead Bird Island

I post stuff from LEAN when it seems pertinent.

View alert on Leanweb.org or lmrk.org

“Dead Bird Island” Testing Results

Report by: Wilma Subra

Results of sampling performed by the Lower Mississippi Riverkeeper in Terrebonne Bay on August 19, 2010

On August 19, 2010, in Terrebonne Bay south of Point-au-Chien, Modato Island was covered with vegetation, bare areas, and a large number of dead shore birds.  The area was designated by the Lower Mississippi River Keeper as “Dead Bird Island.”  The area also contained a number of shore birds in distress, nests containing eggs and a seagull that died shortly after sampling was complete.  Samples were collected along the shore of the island, 10-12 inches deep, under the vegetation matted material washed in by the tide.  The soil/sediment sample was contaminated with 48.4 mg/kg of Petroleum Hydrocarbons and 10 Polynuclear Aromatic Hydrocarbons (0.039 mg/kg).

Dead Tern
A dead gull found on “dead bird island” from which samples were taken

The internal organs from a gull, found dead, on the island contained 23,302 mg/kg Petroleum Hydrocarbons (2.3%).  The Blue Crab and Hermit Crab contained 3,583 mg/kg Petroleum Hydrocarbons and 4 PAHs (0.162 mg/kg).

Taking samples in the marsh
Taking soil samples in the marsh

At the southwest end of Modato Island the sediment/soil was contaminated with higher concentrations of Petroleum Hydrocarbons and Polynuclear Aromatic Hydrocarbons (PAHs), 68.3 mg/kg Petroleum Hydrocarbons and 14 Polynuclear Aromatic Hydrocarbons (0.051 mg/kg).

Hermit Crab
A hermit crab in a welk shell on Modato island

On the north shoreline of Lake Chien, a boom was located 40 feet in from the shore in wetlands vegetation near the high water debris mark.   In the wetlands vegetation near the high water debris mark, the soil/sediment was contaminated with 0.039 mg/kg of 18 Polynuclear Aromatic Hydrocarbons. The Fiddler Crab and Snail from this area contained 6,916 mg/kg Petroleum Hydrocarbons and 1 PAH (0.012 mg/kg).

The marsh  grass along the shoreline of Lake Chien contained 3,946 mg/kg Petroleum Hydrocarbons and 10 PAHs (0.326 mg/kg).

SaveOurGulf.orgVisit SaveOurGulf.org to get more information about the BP Deepwater Horizon disaster from Waterkeeper organizations across the Gulf Coast and donate to Save Our Gulf!.

:}

More tomorrow

:}

The Nastiest Pollution On Earth – End this week with ickypoo

It’s Jam Band Friday – http://www.youtube.com/watch?v=lZJ-5-_f9-4

Next week I will try the cleanest places on the planet as a topic. But do not get your hopes up.

http://www.fastcompany.com/1687376/8-of-the-most-toxic-energy-projects-on-the-planet

8 of the Most Toxic Energy Projects on the Planet

BY Ariel SchwartzTue Sep 7, 2010

BP’s Deepwater Horizon disaster in the Gulf of Mexico served as a wake-up call for many of us who never before paid attention to the destructive energy projects happening all around the world. But while Deepwater Horizon may have attracted the lion’s share of media attention this past Spring and Summer, there are a number of other toxic projects still going on. Below, we look at some of the worst.

:}

http://www.youtube.com/watch?v=XjZCtMg_j04

:}

Alberta Tar Sands

Alberta, Canada is home to the second biggest recoverable oil reserve in the world: the infamous Athabasca tar sands. But the massive deposit of heavy crude oil (aka bitumen) is under a staggering 54,000 square miles of boreal forest and peat bogs, which are slowly being destroyed by the open pit mining used to recover Alberta’s oil. These open pit mining projects also deposit toxic mercury, arsenic, cadmium, and lead into the Athabasca river system, creating “masses of toxic soup.” Suncor Energy, Syncrude Canada, Shell Canada, Marathon Oil, and Chevron are all pursuing projects in the Athabasca sands.

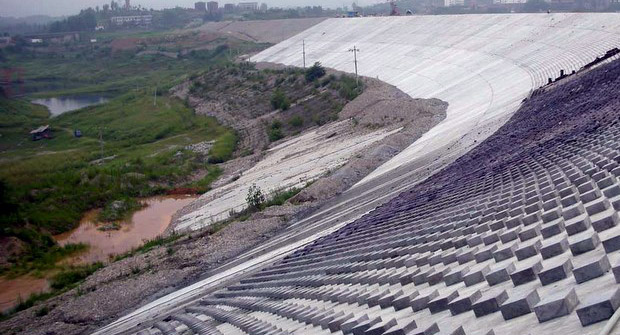
Three Gorges Dam

China’s Three Gorges Dam, a hydroelectric dam in the Yangtze river, is world’s largest electricity-generating plant. Completed in 2006, the dam has already produced 348.4 TWh of electricity since its inception. But the Dam has its drawbacks–construction displaced 1.2 million people (not the only Chinese water project to displace huge populations), increased the risk of landslides in the area, and made nearby Shanghai significantly more vulnerable to flooding.

:}

Please read this gut wrenching article. More next week.

http://www.youtube.com/watch?v=ZZhfmBPl4Lc

:}

A Site Dedicated To The Worst Pollution On The Earth – They found their niche

The world has gotten so polluted that there is a site devoted entirely to that.

http://www.worstpolluted.org/pollution-facts-2009.html

Pollution Facts

Pollution is a Global Killer

Pollution likely affects over a billion people around the world, with millions poisoned and killed each year.  The World Heath Organization estimates that 25 percent of all deaths in the developing world are directly attributable to environmental factor.1 Some researchers estimate that exposure to pollution causes 40 percent of deaths annually.2

Pollution is Regarded as a Major (and quickly emerging) Factor in Disease

People affected by pollution problems are much more susceptible to contracting other diseases.  Others have impaired neurological development, damaged immune systems, and long-term health problems.

Women and Children are Especially at Risk, Children are Most Susceptible

Children are physiologically different and more vulnerable than adults. In some cases they have higher exposures since they eat, drink and breathe more per kilogram of body weight than adults and tend to ingest a lot more dirt and house dust than adults from their crawling around and playing outside.

While children only make up 10 percent of the world’s population, over 40 percent of the global burden of disease falls on them.  Indeed, more than three million children under age five die annually from environmental factors.

Death is Not the Only Toll of Exposure to Pollutants

Pollution causes chronic illness, neurological damage and shortened lifespan. For instance, the presence of lead in children lowers I.Q. by an estimated 4-7 points for each increase of 10 ?g/dL.3 Our database identifies populations around the globe with blood lead levels ranging from 50 -100 ?g/dL, up to 10 times the WHO reference levels for protection against neurological damage.

:}

More Tomorrow.

:}

10 Most Polluted Rivers – Don’t get me started on lists

Don’t get me started on lists…Like the 10 most environmental tips or the 20 ways to save the environment. Why just 10? Why just in America. What about the 10 most polluted mansions in America. It is all arbitrary. Of course the Pacific is not normally a river either. 2 of the top 3 border on Illinois. Go figure.

http://www.freedrinkingwater.com/water_quality/quality1/1-americas-ten-most-polluted-rivers.htm

Where are America’s ten most polluted rivers?

Where does human waste mingle with household chemicals, personal hygiene products, pharmaceuticals, and everything else that goes down the drains in American homes and businesses? In sewers. And what can you get when rain, pesticides, fertilizers, automotive chemicals, and trash run off the streets and down the gutters into those very same sewers? Sewage backing up into people’s basements. Sewage spilling onto streets and parks. Sewage pouring into rivers and streams. Each year, more than 860 billion gallons of this vile brew escapes sewer systems across the country. That’s enough to flood all of Pennsylvania ankle-deep. It’s enough for every American to take one bath each week for an entire year.

After bursting out of a pipe or manhole cover, this foul slurry pollutes the nearest body of water. Downstream, some of it may be pumped out, treated, and piped into more homes and businesses. From there, it goes back into a sewer system, and the cycle resumes. This is the situation along the Susquehanna River – which annual ranks in the top 15 of America’s Most Endangered Rivers list. One hundred and twenty three major sewer systems in the Susquehanna River watershed link toilets and faucets from New York to Maryland. Where the Susquehanna widens and becomes the Chesapeake Bay, vanishing sea grasses and dwindling seafood harvests provide evidence of poor sewage treatment and frequent sewage spills upstream.

A Threat to Human Health.

Untreated human sewage teems with salmonella, hepatitis, dysentery, cryptosporidium, and many other infectious diseases. One hundred years ago, epidemics of these diseases helped limit the life expectancy of a U.S. citizen to about 50 years. Estimates vary for how many people sewage still sickens or kills each year, but they are all large. Germs linger even after the stench of sewage has dispersed. Healthy adults may never realize that yesterday’s swim caused today’s cough, diarrhea, or ear infection.

Young children, their grandparents, and people already weakened by illness are more likely to become seriously ill or die. Scientists believe as many as 3.5 million Americans get sick each year after swimming, boating, fishing, or otherwise touching water they thought was safe.

A 1998 study published in the International Journal of Epidemiology blamed water pollution for one-third of all reported gastroenteritis cases and two-thirds of all ear infections. So…just which ten rivers are typically the most polluted? Of course the list changes from year to year, but the ten below typically rank high.

On the list below you will see the name of the river and the states most responsible for the polluted conditions of the river.

1. Mississippi River TN, AR, LA, MO, IL, MN, WI, IA, KY, MS

2. Pacific Ocean OR, HI, CA

3. Ohio River IL, IN, OH, KY, WV, PA

:}

More unfortunately tomorrow.

:}

Most Polluted Countries In The World – According to one source

http://crunkish.com/top-10-pollution-causes/

Top 10 Most Polluted Countries

The United States is best known as the country with greener pastures. You’d probably move to the US because of this reason. Then again, if you were told that the US is a silent killer, wouldn’t you rather move to China?

Pollution is a silent killer that endangers not just a person’s health, but also his or her environment. Here are the top 10 most polluted countries in the world along with the reasons for why you should be more concerned about your environment.

1. Peru: The Grass is Never Greener

Water Pollution - Peru

Water pollution in Peru

The environmental problems in Peru include deforestation, soil erosion, soil pollution, water pollution and air pollution. Water pollution in Peru is caused by oil-related waste, sewage waste and industrial waste.

Peru has 1,746 cubic kilometers of renewable water resources. Seven percent is for industrial activity and 86 percent is used for farming. In Lima, Peru, vehicular and industrial emissions bring air pollution, which has always been a serious problem in the country’s capital city.

2. Pakistan: Because Cleanliness is the New Virtue

Lahore Pakistan

A polluted street in Lahore, Pakistan

There is hardly any attention paid to the environmental issues in Pakistan. Potable water and sanitation are the main problems in this country. Almost 80 percent of the total population in Pakistan does not have flush toilets.

Research conducted by the Pakistan Medical Research Council show that a large number of people with diseases in Pakistan suffer specific health problem because of the consumption of polluted water. A whopping 38 percent of the entire population of Pakistan receive water that run through dirty pipelines, which, in turn, may lead to the consumption of seriously contaminated water.

3. Kuwait

Kuwait Oil Pollution

Oil Pollution in Kuwait

The oil fires have already been put out and a large part of the oil spills are now cleaned up. However, Kuwait is still suffering from the health and environmental costs brought about by the Gulf War and Iraq’s occupation.

Oil pollutes a large part of the deserts of Kuwait. Oil envelopes the large patches of Kuwait’s sea bed off the coast. The coral reefs in Kuwait need to undergo a serious recovery. The ruptured tanks from the war left debris all over Kuwait that still pollute and destroy Kuwait’s environment after 10 years. Since 1991, children in Kuwait have been acquiring leukemia caused by residues from DU or depleted uranium.

:}

Read the rest. There was a reason why Russia caught fire.

More tomorrow.

:}

Most Polluted Places – Apparently I could do this for a long time

Its Jam Band Friday – http://www.youtube.com/watch?v=3I1bBcda4Ko

:}

Why is that. Because the WHOLE world is polluted. Most of these places didn’t even make the last two lists.

http://www.thedailybeast.com/blogs-and-stories/2010-05-19/americas-28-most-polluted-places/

Our Most Polluted States

by The Daily Beast Info

BS Top - Polluted Sites Greenpeace marine biologist Paul Horsman shows globs of oil on a jetti at the mouth of the Mississippi River on May 17, 2010. (John Moore / Getty Images) As the EPA and BP fight over the Gulf oil spill cleanup, the Daily Beast crunches the numbers and ranks the most contaminated sites in the nation.

The BP oil rig explosion has led to untold millions in lost income for people who make their living from the Gulf, but toxic hazards are an everyday occurrence: The EPA estimates that there are 3,500 chemical spills each year, requiring $260 million to clean.

Above those, however, are the Superfund sites—places that have sustained major, long-term damage, necessitating years of cleanup. Established in 1980 after a series of toxic disasters, including the infamous Love Canal district of Niagara Falls, which turned the neighborhood into a virtual ghost town, Superfund has largely succeeded in centralizing hazardous waste cleanup and holding responsible parties financially accountable.

The BP fiasco—both a natural and human disaster—got us thinking: what are today’s most polluted toxic dumping grounds? To figure it out, we examined all available Superfund data from the Environmental Protection Agency. We filtered the results, focusing on sites that remain dangerous for human exposure and sites that have dangerous ground water. And then we ranked them using the following criteria:

· Toxicity per acre: The number of instances of each toxin, multiplied by the severity of each toxin, according to the Agency for Toxic Substances & Disease Registry, and divided by the acreage of the site.

· Toxicity per population: To determine potential human exposure we took the number of instances of each toxin, multiplied by the severity of each toxin, and divided by the population within one mile of the site. (The EPA gives a population range, and we used the higher number for this calculation.)

Since toxicity per acre is a more concrete statistic than potential human exposure (one can live near a toxic site and avoid contact), we weighted the former three times the impact of the latter. An important note: The human exposure element does not measure exposure levels, but rather indicates that the EPA believes there is a reasonable expectation that people may be exposed to contamination—exactly what the Superfund teams spend their time trying to alleviate.

:}

http://www.youtube.com/watch?v=2maAPVOZlkc&feature=fvw

:}

Acres: 2
Population: 10,000
Toxic chemicals: 34

History: From 1949 to 1991 Fletcher’s Paint Works operated a retail store and storage facility in this small New Hampshire town along the Souhegan River. In 1982 New Hampshire officials found leaking and open drums of paint chemicals in the storage area. Soil and groundwater around the site was later found contaminated with arsenic, lead, PCBs, and a slew of other nasty chemicals. The nearby Keyes Municipal Water Supply Well was shut down in the early 1980s after it was found contaminated by volatile organic compounds—gases emitted from paint and other household supplies. Cleanup began in 1988 and continues today. The EPA has tested homes in the area for gases seeping from soil into basements, with no health risks found in the homes and another round of testing due for June 2010. The main concern now is that fish in the Souhegan contain PCBs, and that the EPA has found evidence of people fishing in the river.

:}

http://www.youtube.com/watch?v=vtCJp1h45gA&feature=related

:}

#2, Haverford, Pennsylvania:
Havertown PCP

Acres: 15
Population: 50,000
Toxic chemicals: 59

History: Getting rid of toxic waste used to be so simple. National Wood Preservers, which treated wood on the site from 1947 to 1963, would take their liquid waste lined with pentachlorophenols (PCPs) to a well, and dump it down. Or they would toss the PCP-laden liquid onto the ground. A nearby stream was contaminated, though residents living within a mile of the site don’t use it for drinking water. In 1992 the EPA removed 97,000 tons of liquid waste, and 60 tons of sludge from the site. The EPA is armed with $4.2 million from the Recovery Act to finish the final cleanup phase, which includes removing contaminated soil from residential property and public spaces.

:}

There is 2. For the rest read the article. HAPPY LABOR DAY everyone. More next week.

http://www.youtube.com/watch?v=VX0cMoOiIMQ&feature=related

:}

Most Polluted Beaches In The US – Ready to take a Labor Day dip

As they say in the article, make sure it is not a dip in an open sewer. I have had this experience. It was one of the reasons I left Tampa never to return. They built their sewage ponds right next to the ocean and when there was a bad storm…it would all wash into the water. Yuck.

Dirty Dozen: The 12 Most Polluted Beaches in The U.S
Kamelia Angelova | Jul. 29, 2009, 1:15 PM |

dirty-beach-2.jpg

Careful!  The beach you’re rushing off to this weekend might actually be a sewer.

Human and animal waste, among other sewage overflow, contaminate the beachwaters of virtually every sandy retreat in the country.

See the dirtiest beaches in the country >

There were over 20,000 closing and advisory days last year at ocean, bay and Great Lake beaches because of high levels of bacteria and pollutants in the waters, according to the annual beachwater quality report – Testing The Waters – released today by the Natural Resources Defense Council (NRDC).

The agency also provides 5-star rating guide for 200 of the nation’s most popular beaches, based on beachwater quality, monitoring frequency, and public notification of contamination. Beachgoers who swim in polluted waters are at risk of contracting from various types of skin rashes and infections to meningitis and hepatitis.

Coastal cities can implement various green strategies such as green rooftops and permeable sidewalks to reduce and eliminate stromwater runoff, which overflows the sewage systems and dump polluted water in the oceans and lake.

The 12 Worst Beaches In The U.S. >

:}
I will give you the first one but you have to to the article for the other 11. If you can stand it that is.

Dirty Dozen: The 12 Most Polluted Beaches in The U.S.

1/13

Zach’s Bay at Jones Beach State Park

Zach’s Bay at Jones Beach State Park

Location: Wantagh, New YorkMajor Offenses: Tested repeatedly for high levels of bacteria in the last three years. No public advisories issued.

This popular New York beach, where boaters also often anchor, has failed many of the twice-weekly tests for the last three years. Bacteria-infested water is not the only problem here: Advisories telling you about the high levels of pollutants in the water are almost never posted online or at the beach.

:}

More Tomorrow.

:}

The Most Polluted Places On Earth – This from the Huffinton Post

I am not sure if I agree with the list below, but if you can only pick 9 when there are that many in the Old Soviet Union alone. Well then:

http://www.huffingtonpost.com/2010/08/31/photos-most-polluted-plac_n_693008.html

9 Of The Most Polluted Places In The World (PHOTOS)

Huffington Post |  Barbara Fenig First Posted: 08-31-10 08:26 AM   |   Updated: 09- 1-10 01:55 AM

81

From the highways of Los Angeles to the Citarum River of Bandung, Indonesia, earth’s most polluted city of Linfen, China to the streets of London, the world is laden with man-made pollution. Chemical, air, water and oil pollution ruin the environment, cause premature deaths, spoil the world’s resources and worsen climate change.

As the world’s population soars to nearly 7 billion, we here at HuffPost Green decided to take a virtual tour of some of the world’s most polluted places. Check out our slideshow of nine of the most polluted places in the world. Find out which city’s death rate surpasses its birth rate by 260 percent. Or which city has 50,000 people die prematurely each year due to man-made air pollution. As always, we want to hear from you. Tell us what you think in the comments.

Linfen, China
1 of 10

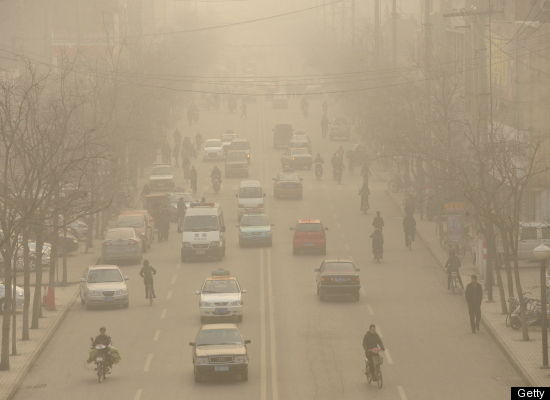
Linfen, China is the most polluted city on earth. According to Mother Nature Network, if one puts laundry out to dry, it will turn black before finishing drying. Located in China’s coal belt, spending one day in Linfen is equivalent to smoking three packs of cigarettes. 3 million people are affected by Linfen‘s coal and particulates pollution, which is residue from automobile and industrial emission

:}

Only one of nine. Please go see the rest. More tomorrow

:}

Are You Ready For Some Lawsuits – Gulf Coast oil spew will be in court for 25 years…

Of course I will be dead by then so I won’t care.
:}
LOUISIANA ENVIRONMENTAL ACTION NETWORK AND REPRESENTING ATTORNEY STUART SMITH CREATE WEBSITE FOR PUBLIC EXAMINATION OF ENVIRONMENTAL SAMPLING DATA IN AREAS IMPACTED BY BP CATASTROPHE
For weeks, Attorney Stuart Smith and researchers Dr. William Sawyer and Marco Kaltofen have been providing evidence contrary to the federal government’s assertions that the oil from the BP DEEPWATER HORIZON catastrophe is gone and that seafood from oil-impacted waters are not compromised.
Now, citizens can examine for themselves data compiled by Gulf Oil Disaster Recovery and the Louisiana Environmental Action Network (LEAN) at a public website maintained by Dr. Kaltofen’s company, Boston Chemical Data.
“We are thrilled about this new resource,” said Marylee Orr, Executive Director, LEAN. “This website allows anyone interested to see what chemicals were found, where they were found, and how much was found. We feel the public has the right to this information.”
The website, http://bostonchemicaldata.com/LEAN/ provides oil spill data and mapping resources. You can compare where EPA, universities and independent labs have sampled. An individual must download Google Earth in order to view the site’s various downloads and maps.
“This should be useful to environmental groups and the unified command,” said Mr. Smith. “We’ve always believed there should be more transparency in this process.”
Most recently, Mr. Smith’s team has documented a large oil plume offshore of northwest Florida which is killing seafood. Samples have been sent to Canada for independent assessment.

“As state and federal officials continue to open Gulf waters to fishing, we have to again point to evidence that the ‘all clear’ is being sounded way too early,” said Mr. Smith, who represents the United Commercial Fishermen’s Association, the Louisiana Environmental Action Network, public entities in the Gulf Coast, as well as private property and business owners. “One of the cautionary notes is that our experts have documented that toxic chemicals remain in the water and food chain – and pose a significant health risk. Those studies have shown that PAHs (polynuclear aromatic hydrocarbons) are present in shrimp from the impacted area. And the PAHs in off-shore Florida are at levels 43 times the levels of shrimp from inland, low-impact inland areas sampled in Louisiana. In our estimation, it may take eight months before the toxic soup has had substantial enough biodegradation to announce an ‘all clear’ on seafood.”
###

FOR MORE INFORMATION:
www.smithstag.com
www.gulfoildisasterrecovery.com
www.oilspillaction.com
www.leanweb.org

Dr. William Sawyer: Chief Toxicologist of Toxicology Consultants & Assessment Specialists, LLC., Sanibel, FL (Registered d/b/a 1990, Incorporated January, 1994, 2009-FL)
Marco Kaltofen, P.E.; President of Boston Chemical is a Registered Professional Engineer (Civil, Massachusetts) and an environmental scientist with more than 25 years experience in environmental, workplace and product safety investigations in North America and Eastern Europe.

CONTACT:

S. Smith: (504) 593-9600        C. Brylski/H. Harper (504) 897-6110

:}

More tomorrow

:}

President Obama And His Family Went To New Orleans – Here is what they saw

Testing Results Returning With High Levels

Report by: Wilma Subra

Results of sampling  performed by the Lower Mississippi River Keeper in the Lower Atchafalaya Bay area on August 2, 2010

Collecting oysters from Oyster Bayou
The shore of the Gulf of Mexico east of Oyster Bayou, where the Atchafalaya Bay meets the Gulf of Mexico, contained visible oil on the vegetation along the shore line.  Soil in this location contained Carbon Disulfide, 378 mg/kg Hydrocarbons and six Polynuclear Aromatic Hydrocarbons (PAHs) (0.222 mg/kg). The oiled vegetation contained 2.3% Hydrocarbons and 31 PAHs (0.554 mg/kg) that  corresponded strongly to the PAHs in the Deepwater Horizon Crude Oil spill.  Samples of Blue Crab and Fiddler Crab contained 2,230 mg/kg hydrocarbons.
Oysters sampled from a reef on Oyster Bayou in Atchafalaya Bay contained 8,815 mg/kg Hydrocarbons.

Results of sampling performed by the Lower Mississippi River Keeper in the Mississippi River Delta on August 3, 2010

Taking samples in the Mississippi River Delta
At the mouth of Pass-a-Loutre, in the reed vegetation along the shore of an island, a sediment sample was collected.   The sediment contained 71 mg/kg Hydrocarbons and 14 PAHs (0.8713 mg/kg).  The PAHs in the sample weakly support that the contaminants in the sediment are associated with the crude oil from the Deepwater Horizon.  A muscle sample collected at this location contained 6,900 mg/kg Hydrocarbons and seven PAHs (0.386 mg/kg).
A sample of oysters was collected from oysters growing on  an abandoned crab trap between Pass-a-Loutre and Redfish Bay.  The oysters contained  12,500 mg/kg (1.25%) Hydrocarbons and two PAHs (0.063 mg/kg).
Along a beach area near Redfish Bay, samples were collected from a stained area along a sandy beach area and from a vegetated area behind the beach.  The beach area had clean-up waste materials and supplies left behind by cleanup crews.  A small water body adjacent to the beach had a boom in the water and a small boat used to place the poles that secured the boom was stained with oil.  The beach area contained a number of tar balls.
The sandy soil sample contained  Carbon Disulfide, Hydrocarbons  (146 to 779 mg/kg),  and 29 to 38 PAHs (3.7259 to 3.934 mg/kg).  The PAHs support reasonable evidence that the sandy soil is contaminated with crude oil from the Deepwater Horizon.

Samples were also collected from the vegetated area (reed vegetation) behind the beach.  The vegetated area contained  oil sheens on the vegetation and on the water that collected in the sampling area.  The soil/sediment samples contained Carbon Disulfide, 2-Butanone (MEK), Toluene, 0.4 to 1.16 % Hydrocarbons, and 20 to 40 PAHs (49 to 189 mg/kg).  The PAHs in the soil/sediment strongly support that the soil/sediment is contaminated with crude oil from the Deepwater Horizon.


SaveOurGulf.orgVisit SaveOurGulf.org to get more information about the BP Deepwater Horizon disaster from Waterkeeper organizations across the Gulf Coast and donate to Save Our Gulf!

:}
Just kidding – More Tomorrow
:}