In a province running out of conventional oil and gas, Alberta’s oilsands are seen as a lifeline that will guarantee the continuation of our comfortable energy-driven society.
By The Edmonton Journal July 29, 2006
In a province running out of conventional oil and gas, Alberta’s oilsands are seen as a lifeline that will guarantee the continuation of our comfortable energy-driven society.
Too much of the time, people in this province don’t think about the cost of this gigantic oilsands development. It’s easy to do: most Albertans don’t live in, and rarely visit, the northern one-fifth of the province where the oilsands lie. What we don’t personally see or smell or taste, we tend to ignore.
The four-day series on the environmental impact of the oilsands boom written by Journal environment reporter Hanneke Brooymans, which started on Friday, is a valuable corrective to our neglect.
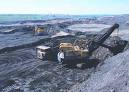
Most of you are already aware of the damage caused by the burning and the extraction of oil (like the apprehended damage caused by extraction in the Arctic Wildlife Refuge, for example). But what about the famous Canadian tar sands? After only two years of digging for bitumen near Fort McMurray in Alberta, Shell has already dug up a pit that is as much as three miles wide and 200 feet deep. 400-ton trucks, said to be the largest in the world, are used to move around all that dirt, and it takes a lot of it since on average 2 tons of tar sand are required to make 1 barrel of oil.
04/01/2009 | 06:49 AMEDMONTON, Alberta — A Canadian oil sands company says more than three times as many ducks died last spring on a northern Alberta toxic waste pond than the 500 birds originally estimated.
Syncrude Canada chief executive Tom Katinas said Tuesday the carcasses of 1,606 ducks were collected from the toxic oily waters. The ponds contain waste from the process of separating oil from sand.
Katinas released the updated figure a week after an Alberta court granted the consortium three more months to enter a plea on federal and provincial wildlife charges. – AP
Construction of a major underground oil pipeline along the eastern edge of Sangamon County could begin as early as this summer.
An energy developer and the Canadian consul general from Chicago are in Springfield this week to seek support for the endeavor as a major boost for jobs and energy security, including a meeting scheduled today with Gov. Pat Quinn.
The first section of the nearly 3-year-old, $350 million construction project has been completed to an area about 50 miles northeast of Peoria.
But the final phase has run into opposition from environmental groups and some landowners, who say the pipeline would only encourage continued reliance on polluting petroleum products and would violate property rights.
“Canada has the second-largest reserves in the world. There’s 170 billion barrels of reserves, and 97 percent are in the oil sands,” said Don Thompson, president of The Oil Sands Developers Group.
Not everyone thinks smart meters are such a smart use of money.
Utilities are spending billions of dollars outfitting homes and businesses with the devices, which wirelessly send information about electricity use to utility billing departments and could help consumers control energy use.
Proponents of smart meters say that when these meters are teamed up with an in-home display that shows current energy usage, as well as a communicating thermostat and software that harvest and analyze that information, consumers can see how much consumption drives cost — and will consume less as a result.
Such knowledge, however, doesn’t come cheap. Meters are expensive, often costing $250 to $500 each when all the bells and whistles are included, such as the expense of installing new utility billing systems. And utilities typically pass these costs directly on to consumers. CenterPoint Energy Inc. in Houston, for instance, recently began charging its customers an extra $3.24 a month for smart meters, sparking howls of protest since the charges will continue for a decade and eventually approach $1 billion.
Consumer advocates fear the costs could be greater than the savings for many households. They also worry that the meters will make it easier for utilities to terminate service — so easy that they will disconnect power for small arrearages that wouldn’t have caused a termination in the past.
View Full Image
John Weber
What’s more, the cost to consumers could go beyond the extra charges imposed by utilities. That’s because consumers usually are left to their own devices (literally) when it comes to adding the in-home displays and home-area networks that use data from the meters to control appliances and other pieces of equipment.
“What we’re most concerned about is that consumers realize real benefits from the meters” from the start, says Michelle Furmanski, general counsel for the Texas House Committee on State Affairs, which is considering legislation that could establish more protections against disconnections.
Ms. Furmanski says that her committee is also looking into the lack of information on meter deployments that is available to the public. The utilities have claimed “trade secret” protections for important financial details about their meter programs, including contract terms with vendors. Such secrecy makes it impossible for consumers to analyze why costs for what appear to be similar services vary so much among utilities.
Subodh Nayar is the Chief Operations Officer of Powerline Telco
Empowering consumers with actionable intelligence about their power will not be the outcome of the deployment of smart meters. Rather, it will be exactly what the utilities intend for it to be: a cost-effective way to implement real-time pricing, demand side management and distribution system monitoring.
Why? The buyer and seller of electricity have opposite power consumption interests. We (buyers) want to have control over the total power we consume and independent confirmation we are getting what we pay for. Electric utilities (sellers) seek to maximize the profits from a business model that requires them to generate, transport and deliver a consistent quality of power — regardless of demand — in exchange for a guaranteed rate of return.
Electricity generated on the power grid isn’t stored, so the grid is engineered and operated to meet peak levels of demand, which might only exist for a few hours per month. Without control over demand, responding to demand spikes will cause the quality of power supplied to fluctuate outside accepted norms, i.e., delivered voltage lags outside the 5 percent acceptable quality band, or frequency fluctuates outside its 2 percent quality band. That can only change if demand can be controlled, so utilities want three things from smart meters:
To protect their return on investment (ROI) by not reducing the total amount of electricity sold.
To free up supply reserved for unpredicted variations in peak demand with direct load control. (If the utility was granted direct control over devices with the highest amperage — the air conditioner (40 amps) and the hot water heater (30 amps) — it could shed 70 percent of the average consumer load, temporarily reducing consumption.)
To reshape the demand curve, shifting demand from the peak busy hours to when demand can be met with baseload power (peak load shaving).
Metering has never been intended to reduce overall consumption.
A smart meter could report on whole house electricity usage, but it could not report on the demand from individual household devices. To make intelligent decisions about energy use, measurement should take place at the outlet, in the device or even on the power cable connecting the device to the outlet. This information can also track the quality of the power being delivered, which can affect the life of the device. Current, temperature and time data could be collected inexpensively, using existing technology, and transmitted over an Internet connection to one of the many service providers with a business intelligence platform. This data can be mined to reveal power quality issues that affect consumption. For example, a low voltage reading will tell you that the device will need to draw more current, increasing the total power cost for that device. Or if your dishwasher were drawing a current for longer than similar appliances, that could alert consumers that a maintenance check is in order.
:}
I tend to think of them as just better meters myself. But to the industry itself they WILL give you a back rub and carry you to bed and tuck you in when you fall asleep:
Six summers ago on a particularly warm August afternoon, a tree that should have been trimmed triggered the largest power outage in American history. The problem quickly spread from Ohio throughout the north-eastern United States – eventually leaving more than 40 million people without power.
The economic damages from the massive blackout have been estimated at $6 billion. Smart grid technology could have prevented it from ever happening. A digitised power infrastructure would allow consumers, utilities, and power generation sources to communicate for the first time. In cases where the power grid is stressed, grid operators would be informed of the situation and could react accordingly.
It seems as if the dream of a smart grid may be finally coming true. President Obama has made the technology central to his “rebuilding America” plan as a way to create new jobs and reduce America’s carbon footprint. The stimulus package, enacted in February, included $38.7 billion for the Department of Energy (DOE), of which $4.5 billion is to go directly towards smart grid investments.
:}
Personally technology IS as technology DOES. It is how yah use it yah know.
I have this theory that the oil market is broken. I predicted that gasoline prices would spike this summer NO MATTER what the price of oil. In other words the price of oil has been decoupled. I think it is the result of speculators driving the price up last year past 3$$ a gallon. The Saudi’s always said that that was a “psychological barrier” for Americans. Maybe they were right and the speculators were stupid.
Search results for: » hot energy stocks «
See free report below for more information…
FREE Report!
“The Only Energy Stock You’ll Ever Need”
Obama’s “Repower America” initiative will pour hundreds of billions into new energy projects — creating an estimated 3 million NEW U.S. jobs over the next two years!
Domestic natural gas production will surge… In fact, CNBC claims Obama’s administration “should be a boon to natural gas producers.” Today may be your one-time chance to get in early on the coming “Natural Gas Boom.”
Find out the name and ticker symbol of the leading manufacturer of natural gas pipelines and highly specialized equipment for tapping new natural gas wells in a new FREE report from The Motley Fool called, “The Only Energy Stock You’ll Ever Need!”
To claim your copy of this premium stock report just click the “Click Here, It’s Free” button below and you’ll instantly access our latest and best research, FREE!
Even Warren Buffett has been bamboozled by oil.He admitted it in his latest annual report to the shareholders of Berkshire Hathaway(NYSE: BRK-A) — the holding company he runs. In his own words: “I bought a large amount of ConocoPhillips(NYSE: COP) stock when oil and gas prices were near their peak. I in no way anticipated the dramatic fall in energy prices that occurred in the last half of the year.”Specifically, he made the bulk of his purchases during the six months ending Sept. 30, 2008 — you know, the same time in which oil prices peaked near $150 a barrel.
The price of oil is now around $50 a barrel, and ConocoPhillips’ stock price has tanked in lockstep with the oil freefall. Buffett clearly bought oil too early. But is it still too early for us to buy up oil stocks now?
Now may be the time
Those bullish on oil point to the inevitability of “peak oil,” arguing that the time will come when we hit the peak of global oil production. From that point on, we’ll be able to pump less and less oil out of the ground. In economic terms, we’ll face decreasing supply.
Meanwhile, bulls argue that demand will increase greatly, as China and other emerging markets fuel their economic growth with oil. On average, each person in the U.S. consumes about 25 barrels of oil a year; each person in China consumes just more than two. That’s a lot of possible future demand.
And all of us amateur economists know what happens when you restrict supply while simultaneously increasing demand: prices rise.
But then again …
Um, weren’t these the same arguments made when oil was at $147 a barrel? Yup. At that price, all these favorable supply and demand assumptions were baked in, and then some. The subsequent price fall highlights that we’ll only make great returns if we buy at low prices.
With oil prices at a third of their summer highs, oil plays are certainly tempting now. Getting in at steep discounts to the prices Buffett paid is a wonderful thing. However, when we look back in time, we see that current oil prices are four times the lows of the late 1990s.
In other words, looking at price movements by themselves just isn’t that helpful. We need to estimate oil’s intrinsic value.
How do we do that?
Beyond bubbles and busts, oil should sell at its marginal cost of production, plus some profit. Unfortunately, that’s not easy to calculate with much precision. Some oil sources are really easy to find and extract (traditional onshore) while others are especially onerous (especially oil sands and deepwater).
Oil prices fell Wednesday, weighed by weaker stock markets and waning optimism that the U.S. economy will soon recover from its severe recession.Benchmark crude for May delivery fell $1.09 to $48.06 a barrel by afternoon in Europe in electronic trading on the New York Mercantile Exchange. The contract fell $1.90 on Tuesday to settle at $49.15.Oil and stock markets have dropped this week, winding back March’s big rally, as investors eye what could be a grim first quarter U.S. corporate earnings season.
Oil traders often look to stocks as a measure of investor sentiment about the overall economy. The Dow Jones industrial average fell 2.3 percent Tuesday. Asian and European markets also dropped Wednesday.
Alcoa Inc., the world’s third-largest aluminum maker, reported a loss of $497 million for the first three months of the year as revenue dropped 44 percent. Alcoa was the first blue chip company to report first quarter earnings and is considered an indicator of upcoming results from other firms.
“The rally we saw in oil and equities was based on optimism that all the fiscal stimulus will be effective in sparking demand down the track,” said Toby Hassall, an analyst with Commodity Warrants Australia in Sydney. “But we haven’t seen much evidence of that yet.”
Let us say that you had an operable form of cancer and your doctor offered you chemotherapy. What would you say to him? Let us imagine that you had a torn tendon and your doctor offered you aspirin as your main form of treatment. What would you say? Actually you would probably CHANGE doctors…
Drilling began this week for a carbon dioxide injection well as part of an $84.3 million project beneath Archer Daniels Midland Co. property.Workers have started constructing a well that will reach more than 6,500 feet underground. The drilling of the injection well is expected to be completed in late March or early April.
No objections were filed before a late January deadline for an Illinois Environmental Protection Agency permit approving the process. That clears the way for the drilling equipment to be moved into place, said Sallie Greenberg, Illinois Geological Survey communications coordinator. The project is intended to capture carbon dioxide from ADM’s ethanol plant, convert it into liquid and pump it underground for storage before it’s emitted into the atmosphere. The U.S. Department of Energy expects 1 million tons of carbon dioxide from the plant to be injected over a three-year period, beginning in early 2010. The project is intended to reduce the amount of carbon dioxide that contributes to global warming.
Midwest Geological Sequestration Consortium receives Phase III funding Storage, Feb 21 2008 (Carbon Capture Journal)
– The Midwest Geological Sequestration Consortium (MGSC), and the Illinois State Geological Survey (ISGS) have been awarded a $66.7 million contract from the US DOE.
The funding is to conduct a Phase III large-scale sequestration demonstration project in the Mt. Simon Sandstone.
The MGSC, ISGS, and Archer Daniels Midland Company (ADM) will work together on this carbon sequestration project, which will involve the capture and storage of CO2 from ADM’s ethanol plant in Decatur, Illinois.
The $84.3 million project will be funded by $66.7 million from the U.S. Department of Energy over a period of seven years, supplemented by cofunding from ADM, Schlumberger Carbon Services, and other corporate and state resources.
The project is designed to confirm the ability of the Mt. Simon Sandstone, a major regional saline reservoir in Illinois, to accept and store 1 million metric tonnes of CO2 over a period of three years.
:}
Already they are a year behind..Why does this sound like a replay of NUCLEAR Power. Delays….Cost over runs….Accidents… All to avoid leaving the nasty stuff in the ground in the first place. Even Scientific America gets into the act:
OXYFUEL: In September 2007 the oxyfuel combustion chamber is lifted into place at the Schwarze Pumpe power plant in Germany–one of the first power plants in the world to capture carbon dioxide. Courtesy of Vattenfal
Editor’s Note: This is the first in a series of five features on carbon capture and storage, running daily from April 6 to April 10, 2009.
Like all big coal-fired power plants, the 1,600-megawatt-capacity Schwarze Pumpe plant in Spremberg, Germany, is undeniably dirty. Yet a small addition to the facility—a tiny boiler that pipes 30 MW worth of steam to local industrial customers—represents a hope for salvation from the global climate-changing consequences of burning fossil fuel.
To heat that boiler, the damp, crumbly brown coal known as lignite—which is even more polluting than the harder black anthracite variety—burns in the presence of pure oxygen, a process known as oxyfuel, releasing as waste both water vapor and that more notorious greenhouse gas, carbon dioxide (CO2). By condensing the water in a simple pipe, Vattenfall, the Swedish utility that owns the power plant, captures and isolates nearly 95 percent of the CO2 in a 99.7 percent pure form.
That CO2 is then compressed into a liquid and given to another company, Linde, for sale; potential users range from the makers of carbonated beverages, such as Coca-Cola, to oil firms that use it to squeeze more petroleum out of declining deposits. In principle, however, the CO2 could also be pumped deep underground and locked safely away in specific rock formations for millennia.
From the International Energy Agency to the United Nations–sanctioned Intergovernmental Panel on Climate Change (IPCC), such carbon capture and storage (CCS), particularly for coal-fired power plants, has been identified as a technology critical to enabling deep, rapid cuts in greenhouse gas emissions. After all, coal burning is responsible for 40 percent of the 30 billion metric tons of CO2 emitted by human activity every year.
“There is the potential for the U.S. and other countries to continue to rely on coal as a source of energy while at the same time protecting the climate from the massive greenhouse gas emissions associated with coal,” says Steve Caldwell, coordinator for regional climate change policy at the Pew Center on Global Climate Change, a Washington, D.C. think tank.
Even President Barack Obama has labeled the technology as important for “energy independence” and included $3.4 billion in the $787 billion American Recovery and Reinvestment Act for “clean coal” power.
Today three types of technology can capture CO2 at a power plant. One, as at Schwarze Pumpe, involves the oxyfuel process: burning coal in pure oxygen to produce a stream of CO2-rich emissions. The second uses various forms of chemistry—in the form of amine scrubbers, special membranes or ionic liquids—to pull carbon dioxide out of a more mixed set of exhaust gases. The third is gasification, in which liquid or solid fuels are first turned into synthetic natural gas; CO2 from the conversion of the gas can be siphoned off.
:}
Then there is this:
ckmapawatt at 10:27 PM on 04/06/09
NO, NO, NO.  Carbon Capture and Storage is not the answer!  It is treating the symptoms and not the disease.

I recently wrote a blog looking at this same issue:

http://blog.mapawatt.com/2009/03/13/carbon-capture-and-storage/Basically, we can take BILLIONS and spend it on burying something underground, or we can spend that money and put it to good use while taking the same amount of CO2 out of the air.

Carbon Capture is short term decision making and thinking that is mainly being promoted by the Coal Industry.  Would you really call Carbon Capture a sustainable practice?
(Disclaimer: the below article is a thought experiment. I’m not suggesting it as a real solution, but rather a way to analyze two different carbon mitigating strategies. Enjoy!)
You might have seen the environmental articles recently related to Carbon Capture and Storage (CCS). Basically, all CCS does is take the CO2 that coal plants produce, collect it, and pump it underground. Sounds like a good idea right? Well, on the surface it does, but let’s dig down into the actual numbers a little bit.
In order to better understand the proposed function of CCS, let’s walk through a comparison of a power generation plant with and without CCS. I’m going to look at two options:
Option 1: 500 MW (capacity before CCS) IGCC (type of coal plant) with Carbon Capture and Storage
Option 2: 500 MW IGCC plant with the money that would be used on CCS to be spent on a wind farm
In comparing our two options, pretend you’re the President of Power Generation Company for planet Earth (this is a made up company. The point is you base your decisions on what is best for the planet and the people buying your power. You don’t base your decisions on politics). In both options the 500 MW IGCC plant is already installed, you are just comparing whether to spend money on carbon capture and storage, or take the equivalent amount of money and use it for another purpose that would help the environment, in this case a wind farm.
You may ask: Why do I want to install a wind farm if my goal is to reduce CO2 (even though your real goal is to do what’s best for Earth)? Because you are all powerful, you are going to figure out how much energy the wind farm produces, then find an old dirty coal plant that produces the same amount of energy, and take that coal plant off line. Therefore, reducing the amount of CO2 that enters the atmosphere by enabling the old coal plant to be taken off line, and also helping wind power reach economies of scale.
Installing CCS or a Wind Farm that replaces old Coal:
A recent paper by David and Herzog at MIT estimated the future cost of CCS at $1,145/kw (estimated cost in 2012) of installed power. So, for the 500 MW IGCC plant, it would cost $572.5 million dollars to install CCS technology. Now, you have the option of taking this money and using it to buy a Wind Farm instead. The American Wind Energy Association states that it costs about $ 1 million to install 1 MW of generating capacity for a wind farm. Therefore, $572.5 million will enable you to install 572 MW of installed wind energy (with $500 k left over)!
In order to analyze how much CO2 will be kept out of the atmosphere by taking the old coal plant off line, we have to calculate the yearly power output of the wind farm. To do this, you need what is called a Capacity Factor. Basically, this is just the percentage of time during the year that a power producing facility produces power at its rated capacity. The organization National Wind Watch states that in 2003, the average capacity factor for US wind farms was 26.9%. Therefore, to calculate how much energy the wind farm produces (MWh) during the year:
Yearly Output (MWh) = (installed capacity)*(capacity factor)*(hours in a day)*(days in a year) =
Now we have to use this value to decide how big a coal plant this would replace. Using the wind farm yearly output and the average capacity factor for Coal plants in the US, which is 73.6%, we can use the above Yearly Energy Output equation to back-solve for the “installed capacity” the wind farm would replace:
Installed Capacity (MW) = (yearly output) ÷ (Capacity factor * hours in a day * days in a year) =
(1,347,884) ÷ (.736*24*365) = 209 MW
Therefore, if you use the $527.5 million dollars it would cost to install CCS on a 500 MW IGCC coal plant for a wind farm, the energy the wind farm produces is equivalent to a 209 MW pulverized coal plant!
While the world drowns in people. The problems with greenhouse gases, ice melt and oceanic acidification, often lumped together under the term Global Warming, are really the end result of world over population. We are 7 billion now and before it is all over we wlll top out at 10 billion. The Earth only has the sustainable resources to support about a billion people well. Had we limited ourselves to that number, we would have eliminated most poverty and most disease. To do that would fly in the face of every religion known to man and everyone’s biological urge to reproduce. So we blindly let nature do it for us. I have no idea what a human biological die off looks like, and I do not want to be here for it. It will happen.
My first heresy says that all the fuss about global warming is grossly exaggerated. Here I am opposing the holy brotherhood of climate model experts and the crowd of deluded citizens who believe the numbers predicted by the computer models. Of course, they say, I have no degree in meteorology and I am therefore not qualified to speak. But I have studied the climate models and I know what they can do. The models solve the equations of fluid dynamics, and they do a very good job of describing the fluid motions of the atmosphere and the oceans. They do a very poor job of describing the clouds, the dust, the chemistry and the biology of fields and farms and forests. They do not begin to describe the real world that we live in. The real world is muddy and messy and full of things that we do not yet understand. It is much easier for a scientist to sit in an air-conditioned building and run computer models, than to put on winter clothes and measure what is really happening outside in the swamps and the clouds. That is why the climate model experts end up believing their own models.
In the mid 1950s, not many scientists were concerned that humanity was adding carbon dioxide gas ( CO2) to the atmosphere by burning fossil fuels. The suggestion that this would change the climate had been abandoned decades earlier by nearly everyone. A particularly simple and powerful argument was that the added gas would not linger in the air. Most of the CO2 on the surface of the planet was not in the tenuous atmosphere, but dissolved in the huge mass of water in the oceans. Obviously, no matter how much more gas human activities might pour into the atmosphere, nearly all of it would wind up safely buried in the ocean depths
Dyson agrees that anthropogenic global warming exists, and has written
“
One of the main causes of warming is the increase of carbon dioxide in the atmosphere resulting from our burning of fossil fuels such as oil and coal and natural gas.
”
However, he has argued that existing simulation models of climate fail to account for some important factors, and hence the results will contain too much error to reliably predict future trends.
“
The models solve the equations of fluid dynamics, and they do a very good job of describing the fluid motions of the atmosphere and the oceans. They do a very poor job of describing the clouds, the dust, the chemistry and the biology of fields and farms and forests. They do not begin to describe the real world we live in…
”
“
As a scientist I do not have much faith in predictions. Science is organised unpredictability. The best scientists like to arrange things in an experiment to be as unpredictable as possible, and then they do the experiment to see what will happen. You might say that if something is predictable then it is not science. When I make predictions, I am not speaking as a scientist. I am speaking as a story-teller, and my predictions are science-fiction rather than science.
”
He is among signatories of a letter to the UN criticizing the IPCC[1]. The letter includes the statements “The average rate of warming of 0.1 to 0. 2 degrees Celsius per decade recorded by satellites during the late 20th century falls within known natural rates of warming and cooling over the last 10,000 years” and “there has been no net global warming since 1998”. Both statements have been criticised as inconsistent with the data.
He has also argued against the ostracisation of scientists whose views depart from the acknowledged mainstream of scientific opinion on climate change, stating that heretics have historically been an important force in driving scientific progress.
Revelle was instrumental in creating the International Geophysical Year (IGY) in 1958 and was founding chairman of the first Committee on Climate Change and the Ocean (CCCO) under the Scientific Committee on Ocean Research (SCOR) and the International Oceanic Commission (IOC). During planning for the IGY, under Revelle’s directorship, SIO participated in and later became the principal center for the Atmospheric Carbon Dioxide Program. In July 1956, Charles David Keeling joined the SIO staff to head the program, and began measurements of atmospheric carbon dioxide at the Mauna Loa Observatory on Mauna Loa, Hawaii, and in Antarctica.
In 1957, Revelle co-authored a paper with Hans Suess that suggested that the Earth’s oceans would absorb excess carbon dioxide generated by humanity at a much slower rate than previously predicted by geoscientists, thereby suggesting that human gas emissions might create a “greenhouse effect” that would cause global warming over time.[3] Although other articles in the same journal discussed carbon dioxide levels, the Suess-Revelle paper was “the only one of the three to stress the growing quantity of CO2 contributed by our burning of fossil fuel, and to call attention to the fact that it might cause global warming over time.”[4]
Revelle and Suess described the “buffer factor”, now known as the “Revelle factor“, which is a resistance to atmospheric carbon dioxide being absorbed by the ocean surface layer posed by bicarbonate chemistry. Essentially, in order to enter the ocean, carbon dioxide gas has to partition into one of the components of carbonic acid: carbonate ion, bicarbonate ion, or protonated carbonic acid, and the product of these many chemical dissociation constants factors into a kind of back-pressure that limits how fast the carbon dioxide can enter the surface ocean. Geology, geochemistry, atmospheric chemistry, ocean chemistry … this amounted to one of the earliest examples of “integrated assessment”, which 50 years later became an entire branch of global warming science.
What may trouble Dyson most about climate change are the experts. Experts are, he thinks, too often crippled by the conventional wisdom they create, leading to the belief that “they know it all.” The men he most admires tend to be what he calls “amateurs,” inventive spirits of uncredentialed brilliance like Bernhard Schmidt, an eccentric one-armed alcoholic telescope-lens designer; Milton Humason, a janitor at Mount Wilson Observatory in California whose native scientific aptitude was such that he was promoted to staff astronomer; and especially Darwin, who, Dyson says, “was really an amateur and beat the professionals at their own game.”IT WAS FOUR YEARS AGO that Dyson began publicly stating his doubts about climate change. Speaking at the Frederick S. Pardee Center for the Study of the Longer-Range Future at Boston University, Dyson announced that “all the fuss about global warming is grossly exaggerated.” Since then he has only heated up his misgivings, declaring in a 2007 interview with Salon.com that “the fact that the climate is getting warmer doesn’t scare me at all” and writing in an essay for The New York Review of Books, the left-leaning publication that is to gravitas what the Beagle was to Darwin, that climate change has become an “obsession” — the primary article of faith for “a worldwide secular religion” known as environmentalism. Among those he considers true believers, Dyson has been particularly dismissive of Al Gore, whom Dyson calls climate change’s “chief propagandist,” and James Hansen, the head of the NASA Goddard Institute for Space Studies in New York and an adviser to Gore’s film, “An Inconvenient Truth.” Dyson accuses them of relying too heavily on computer-generated climate models that foresee a Grand Guignol of imminent world devastation as icecaps melt, oceans rise and storms and plagues sweep the earth, and he blames the pair’s “lousy science” for “distracting public attention” from “more serious and more immediate dangers to the planet.”http://www.pubmedcentral.nih.gov/articlerender.fcgi?artid=33716
In 1975 Roger returned to UCSD to become Professor of Science and Public Policy. For the next 15 years he taught courses in marine policy and population, and he continued to be active in oceanographic affairs. When in 1978 the American Association for the Advancement of Science (AAAS) decided to focus its international efforts on a few selected issues, Roger chaired the AAAS group that identified the build-up of heat-absorbing gases in the atmosphere as one such issue. As a result, the AAAS Board created the Committee on Climate, and Roger served as its chairman for a decade. The Committee was responsible for the first effort to identify the costs and benefits of increased atmospheric carbon dioxide.
He received the National Medal of Science from President George Bush in 1991
for his pioneering work in the areas of carbon dioxide and climate modifications, oceanographic exploration presaging plate tectonics, and the biological effects of radiation in the marine environment, and studies of population growth and global food supplies.
To a reporter asking why he got the medal, Roger (10) said, “I got it for being the grandfather of the greenhouse effect.”
It is difficult to do justice to a man with such broad accomplishments. When questioned about his profession, Roger would reply “I am an oceanographer.”
At this point I return to the Keeling graph, which demonstrates the strong coupling between atmosphere and plants. The wiggles in the graph show us that every carbon dioxide molecule in the atmosphere is incorporated in a plant within a time of the order of twelve years. Therefore, if we can control what the plants do with the carbon, the fate of the carbon in the atmosphere is in our hands. That is what Nordhaus meant when he mentioned “genetically engineered carbon-eating trees” as a low-cost backstop to global warming. The science and technology of genetic engineering are not yet ripe for large-scale use. We do not understand the language of the genome well enough to read and write it fluently. But the science is advancing rapidly, and the technology of reading and writing genomes is advancing even more rapidly. I consider it likely that we shall have “genetically engineered carbon-eating trees” within twenty years, and almost certainly within fifty years.
Carbon-eating trees could convert most of the carbon that they absorb from the atmosphere into some chemically stable form and bury it underground. Or they could convert the carbon into liquid fuels and other useful chemicals. Biotechnology is enormously powerful, capable of burying or transforming any molecule of carbon dioxide that comes into its grasp. Keeling’s wiggles prove that a big fraction of the carbon dioxide in the atmosphere comes within the grasp of biotechnology every decade. If one quarter of the world’s forests were replanted with carbon-eating varieties of the same species, the forests would be preserved as ecological resources and as habitats for wildlife, and the carbon dioxide in the atmosphere would be reduced by half in about fifty years.
It is likely that biotechnology will dominate our lives and our economic activities during the second half of the twenty-first century, just as computer technology dominated our lives and our economy during the second half of the twentieth. Biotechnology could be a great equalizer, spreading wealth over the world wherever there is land and air and water and sunlight. This has nothing to do with the misguided efforts that are now being made to reduce carbon emissions by growing corn and converting it into ethanol fuel. The ethanol program fails to reduce emissions and incidentally hurts poor people all over the world by raising the price of food. After we have mastered biotechnology, the rules of the climate game will be radically changed. In a world economy based on biotechnology, some low-cost and environmentally benign backstop to carbon emissions is likely to become a reality.
Revelle had made an even stronger statement just a few days earlier, in a July 14, 1988 letter to Congressman Jim Bates: “Most scientists familiar with the subject are not yet willing to bet that the climate this year is the result of ‘greenhouse warming.’ As you very well know, climate is highly variable from year to year, and the causes of these variations are not at all well understood. My own personal belief is that we should wait another ten or twenty years to really be convinced that the greenhouse effect is going to be important for human beings, in both positive and negative ways.” Revelle’s writings
In the premiere issue of Cosmos, in 1991, Revelle and coauthors S.F. Singer and C. Starr contributed a brief essay, “What to do about greenhouse warming: Look before you leap.” The three write: “Drastic, precipitous and, especially, unilateral steps to delay the putative greenhouse impacts can cost jobs and prosperity and increase the human costs of global poverty, without being effective.”
They continue, “Stringent controls enacted now would be economically devastating, particularly for developing countries for whom reduced energy consumption would mean slower rates of economic growth without being able to delay greatly the growth of greenhouse gases in the atmosphere. Yale economist William Nordhaus, one of the few who have been trying to deal quantitatively with the economics of the greenhouse effect, has pointed out that ‘. . . those who argue for strong measures to slow greenhouse warming have reached their conclusion without any discernible analysis of the costs and benefits.’”
:}
Dyson’s most remarkable quote is that, “I would rather be wrong than vague”.
To which I would respond, “Sir I would rather be right than dead”.
Well that depends on your perspective. Americans are so used to not calculating the energy that goes into making things that they act like they appear “by magic”. But they require a lot of energy to make and presented with that evidence people might forgo a bunch of “stuff”, objectives, the old material accumulations, valuable possessions and all that.
1. Coal produces what percentage of America’s electricity?
50%. Coal is a dirty 19th century technology, yet still produces half of our electricity. France, in comparison, produces more than 80% of its electricity from carbon-free nuclear power.
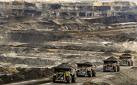
After visiting the border we were taken to the site of an abandoned open pit iron mine. With prices increasing, several companies are considering reopening the mine.
Today, 1984, most of the steel mills in the United States have either phased out or merged with foreign steel mills. — A very sad state of affairs, and leaving millions of steel workers unemployed. — The steel mills exploited the immigrants when they came to this country. — The steel mills made their fortunes and failed to modernize their plants. — They phased them out and invested in foreign plants — exploited those workers and then dumped their steel into this country, and making another fortune. — Yes, I know that this is a free country, and corporations can do what they want with their money, but I always felt that there was a moral obligation on the part of the steel mills, (and other corporations) to re-invest in America.
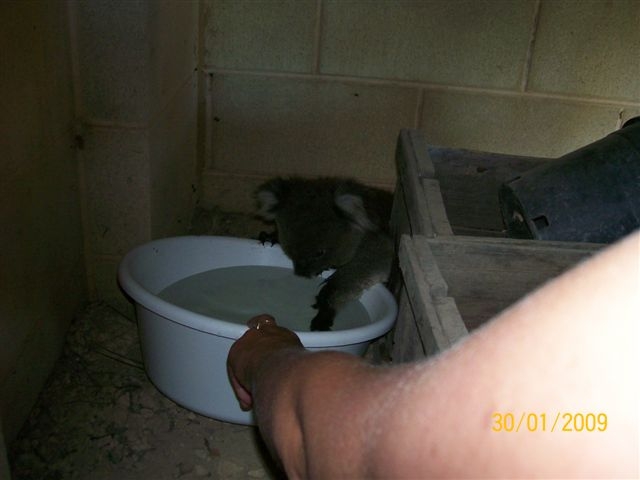
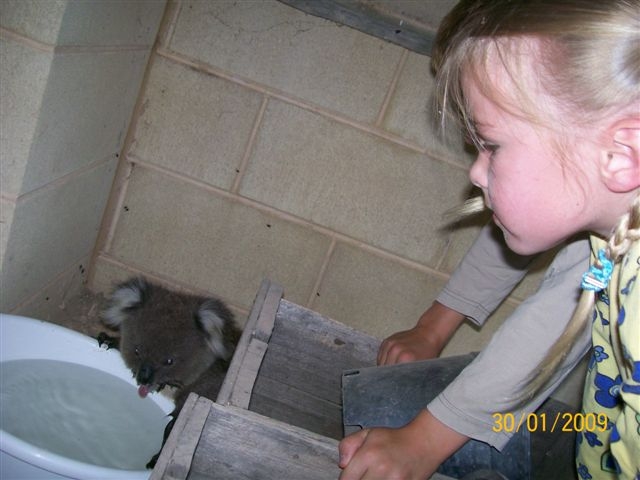
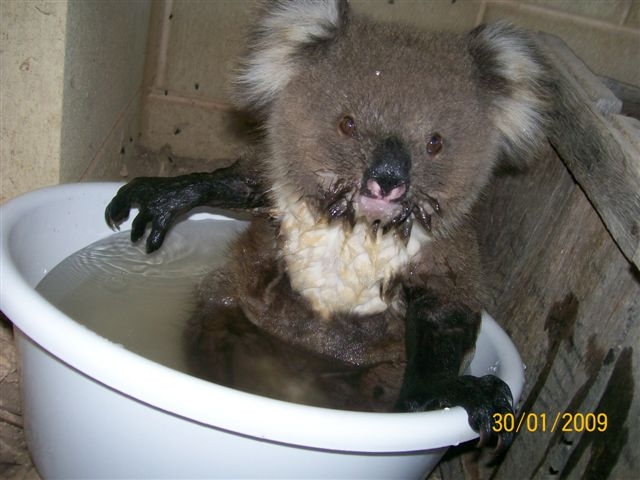
In Victoria the temperature has been above 44 degrees all week and they are forecasting another week of 40+ temperatures. Power is failing, trains have stopped running because tracks are buckling under the heat . It’s just scorching. And it seems that the people are not the only ones suffering. Check out these photos of a little Koala which just walked onto a back porch looking for a bit of heat relief. The woman filled up a bucket for it and this is what happened!
Kinda dark but:
Getting better:
About right:
But see this is actually the effects of Global Warming. We are burning the animals and plants off this planet UP.
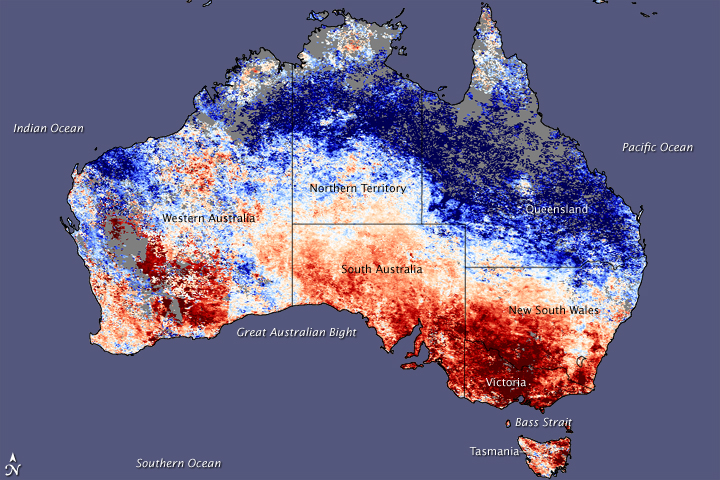
For those who track their local temperatures using the Celsius scale, 40 degrees is a daunting number. In early February 2009, residents of southeastern Australia were cringing at their weather forecasts, as predictions of temperatures above 40 degrees Celsius (104 degrees Fahrenheit) meant that a blistering heat wave was continuing.
This map of Australia shows how the land surface temperature from January 25 to February 1 compared to the average mid-summer temperatures the continent experienced between 2000-2008. Places where temperatures were warmer than average are red, places experiencing near-normal temperatures are white, and places where temperatures were cooler than average are blue. The data were collected by the Moderate Resolution Imaging Spectroradiometer (MODIS) on NASA’s Terra satellite. While southern Australia was scorching, a similarly large area of northern and central Australia was several degrees cooler than it was in the previous nine years. The cool anomaly across that region is probably linked to the above-average rainfall the area has received during this year’s wet season.
Land surface temperature is how hot the surface of the Earth would feel to the touch in a particular location. From a satellite’s point of view, the “surface” is whatever it sees when it looks through the atmosphere to the ground. That could be the sand on a beach, the grass on a lawn, the roof of a building, or a paved road. Thus, daytime land surface temperature is often much higher than the air temperature that is included in the daily weather report—a fact that anyone who has walked barefoot across a parking lot on a summer afternoon could verify.
The Australian Bureau of Meteorology (BOM) called this heat wave “exceptional,” not only for the high temperatures but for their duration. One-day records were broken in multiple cities, with temperatures in the mid-40s. In Kyancutta, South Australia, the temperature reached 48.2 degrees Celsius (118.8 degrees Fahrenheit). Many places also set records for the number of consecutive days with record-breaking heat.
This illustration depicts the warming that scientists have determined has occurred in West Antarctica during the last 50 years, with the dark red showing the area that has warmed the most. Credit: NASA
The frozen desert interior of Antarctica was thought to be the lone holdout resisting the man-made warming affecting the rest of the globe, with some areas even showing signs of cooling.
Some global warming contrarians liked to point to inner Antarctica as a counter-example. But climate researchers have now turned this notion on its head, with the first study to show that the entire continent is warming, and has been for the past 50 years.
“Antarctica is warming, and it’s warming at the same rate as the rest of the planet,” said study co-author Michael Mann of Penn State University.
This finding, detailed in the Jan. 21 issue of the journal Nature, has implications for estimating ice melt and sea level rise from the continent, which is almost entirely covered by ice that averages about a mile (1.6 kilometers) thick. The revelation also undermines the common use of Antarctica as an argument against global warming by contrarians, Mann said.
By Robert Sanders, Media Relations| 21 January 2009
BERKELEY — Not only has the average global temperature increased in the past 50 years, but the hottest day of the year has shifted nearly two days earlier, according to a new study by scientists from the University of California, Berkeley, and Harvard University.
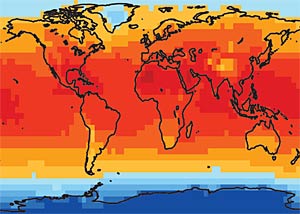
July Febuary The average distribution of global temperatures for July and February. Because the sun is further north in July, the warm bulge of high temperatures is shifted into the northern hemisphere in that month. In the Northern Hemisphere, warm temperatures extend farther north on land than over ocean in the summer and cold temperatures extend farther south on land than on the ocean in the winter. (Image by Alexander R. Stine/UC Berkeley; data from the Climate Research Unit at the University of East Anglia )
Just as human-generated greenhouse gases appear to the be the cause of global warming, human activity may also be the cause of the shift in the cycle of seasons, according to Alexander R. Stine, a graduate student in UC Berkeley’s Department of Earth and Planetary Science and first author of the report.”We see 100 years where there is a very natural pattern of variability, and then we see a large departure from that pattern at the same time as global mean temperatures start increasing, which makes us suspect that there’s a human role here,” he said.
Although the cause of this seasonal shift – which has occurred over land, but not the ocean – is unclear, the researchers say the shift appears to be related, in part, to a particular pattern of winds that also has been changing over the same time period. This pattern of atmospheric circulation, known as the Northern Annular Mode, is the most important wind pattern for controlling why one winter in the Northern Hemisphere is different from another. The researchers found that the mode also is important in controlling the arrival of the seasons each year.
Whatever the cause, Stine said, current Intergovernmental Panel on Climate Change (IPCC) models do not predict this phase shift in the annual temperature cycle.
Details are published in the Jan. 22 issue of the journal Nature.
Isn’t throwing things away basically throwing money on the ground and walking away? Some people assert that discarding behavior originates in our time, historically, spent in the trees. In other words a primate swinging in the trees with no pockets throws everything away, even if its valuable sometimes. In fact if it is valuable and it lands on the ground and there is a predator around it could be lost forever.
Other people say that our discarding behavior is based in our hunting techniques. Once we figured out that we could kill other meat sources by throwing rocks and sticks then it was a simple step to throw other things away as well. But middens are an archaeological constant.
Still other people have pointed out that discarding behavior was probably a fact of our nomadic lives. They argue that for us to retain “things” we would have had to carry them. So there would be a point where a thing, like a broken spear, or a pot would no longer possess enough value that would make it worth carrying on to the next campsite.
A landfill, also known as a dump (and historically as a midden), is a site for the disposal of waste materials by burial and is the oldest form of waste treatment. Historically, landfills have been the most common methods of organized waste disposal and remain so in many places around the world.
Landfills may include internal waste disposal sites (where a producer of waste carries out their own waste disposal at the place of production) as well as sites used by many producers. Many landfills are also used for other waste management purposes, such as the temporary storage, consolidation and transfer, or processing of waste material (sorting, treatment, or recycling).
A landfill also may refer to ground that has been filled in with soil and rocks instead of waste materials, so that it can be used for a specific purpose, such as for building houses. Unless they are stabilized, these areas may experience severe shaking or liquefaction of the ground in a large earthquake.
:}
That hill is a garbage dump on an island in Florida. Or is this worth it?:
A “plastic soup” of waste floating in the Pacific Ocean is growing at an alarming rate and now covers an area twice the size of the continental United States, scientists have said.
The vast expanse of debris – in effect the world’s largest rubbish dump – is held in place by swirling underwater currents. This drifting “soup” stretches from about 500 nautical miles off the Californian coast, across the northern Pacific, past Hawaii and almost as far as Japan.
:}
Please see this article…it is really really really scary.
First, all over the world, temperatures have been dropping in a way wholly unpredicted by all those computer models which have been used as the main drivers of the scare. Last winter, as temperatures plummeted, many parts of the world had snowfalls on a scale not seen for decades. This winter, with the whole of Canada and half the US under snow, looks likely to be even worse. After several years flatlining, global temperatures have dropped sharply enough to cancel out much of their net rise in the 20th century.
But this time of the year you normally have the whole of Canada and half the US under snow. Look at the graph below from the Rutgers Global Snow Lab. If you move your mouse over it, it will show current snow cover. Not much different, is it?
Despite a strong La Nina this year, 2008 was nowhere near as cold as the years at the start of the 20th century.
So what’s the second part of Booker’s disproof of AGW?
Secondly, 2008 was the year when any pretence that there was a “scientific consensus” in favour of man-made global warming collapsed. At long last, as in the Manhattan Declaration last March, hundreds of proper scientists, including many of the world’s most eminent climate experts, have been rallying to pour scorn on that “consensus” which was only a politically engineered artefact, based on ever more blatantly manipulated data and computer models programmed to produce no more than convenient fictions.
OK, lets look at the list of “climate experts” who signed the Manhattan declaration. I don’t see many eminent climate scientists there. Of the 619 authors of the IPCC AR4 WG1, precisely zero signed the Manhattan declaration. There are a couple of eminent climate scientists there: Reid Bryson and Bill Gray, but the vast majority are not climate scientists at all, and the list includes entries like this:
John McLean, Climate Data Analyst, Post-graduate Diploma of Computer Studies, B. Arch., Climate Data Analyst, Computer scientist, Melbourne, Australia
Even if you repeat it, “Climate Data Analyst” is just a title he made up. Study the graphs above of climatic data. Congratulations! You’re analyzing climate data, so you can call yourself a Climate Data Analyst as well.
:}
But Booker is a serious author right? Here is one of his little triumphs:
I must end this year by again paying tribute to my readers for the wonderful generosity with which they came to the aid of two causes. First their donations made it possible for the latest “metric martyr”, the east London market trader Janet Devers, to fight Hackney council’s vindictive decision to prosecute her on 13 criminal charges, ranging from selling in pounds and ounces to selling produce “by the bowl” (to avoid using weights her customers dislike and don’t understand). The embarrassment caused by this historic battle has thrown the forced metrication policy of both our governments, in London and Brussels, into total disarray.
Since Hackney backed out of allowing four criminal charges against Janet to go before a jury next month, all that remains is for her to win her appeal in February against eight convictions which now look quite absurd (including those for selling veg by the bowl, as thousands of other London market traders do every day). The final goal, as Neil Herron of the Metric Martyrs Defence Fund insists, must then be a pardon for the late Steve Thoburn and the four other original “martyrs” who were found guilty in 2002 – after a legal battle also made possible by this column’s readers – of breaking laws so ridiculous that the EU Commission has even denied they existed (but which are still on the statute book).
:}
The EVIL METRIC people must be defeated….HAHAHAHAHAHA

 on 12. 9.05
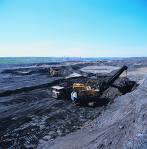


 Febuary
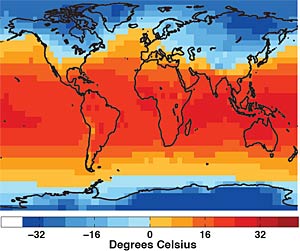

